
Using Help Center Analytics to Improve Your Content
Ferndesk's Reporting dashboard shows you how users interact with your help center, AI assistant, and support channels. Use these insights to identify content gaps, optimize popular articles, and reduce support volume.
Access Reporting from the dashboard sidebar. Use the date range picker (top-right) to filter data by past 7, 30, 90 days, or custom dates.
Help Center Analytics
The Help Center tab tracks article performance and search behavior across four sections:
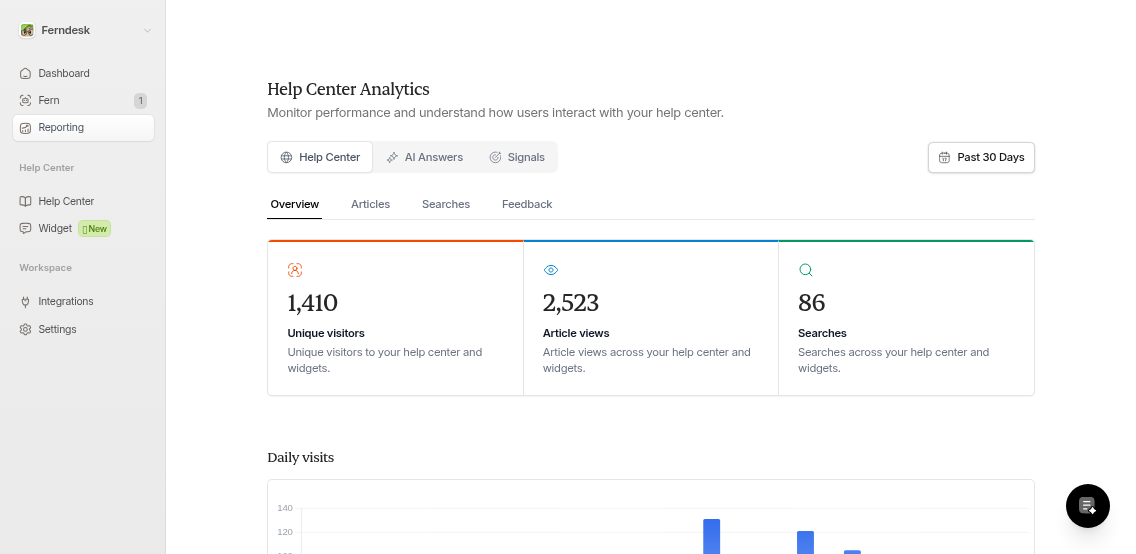
Overview
See daily visitor trends, total article views, and search volume. The top articles table shows which content gets the most traffic.
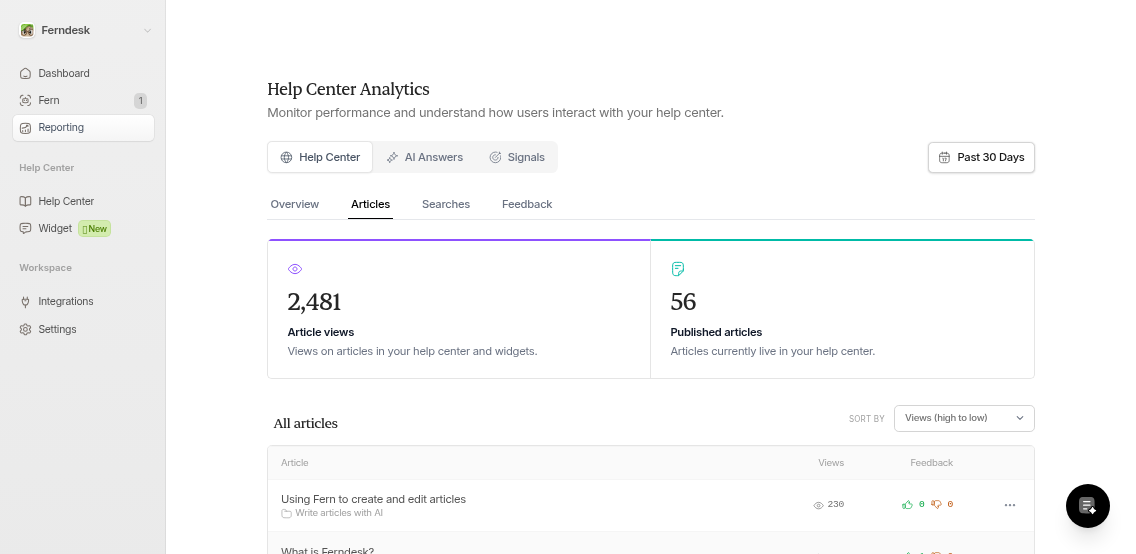
Articles
Track views, upvotes, and downvotes for each published article. Sort by engagement to find high-traffic content that needs improvement or low-traffic articles to deprecate.
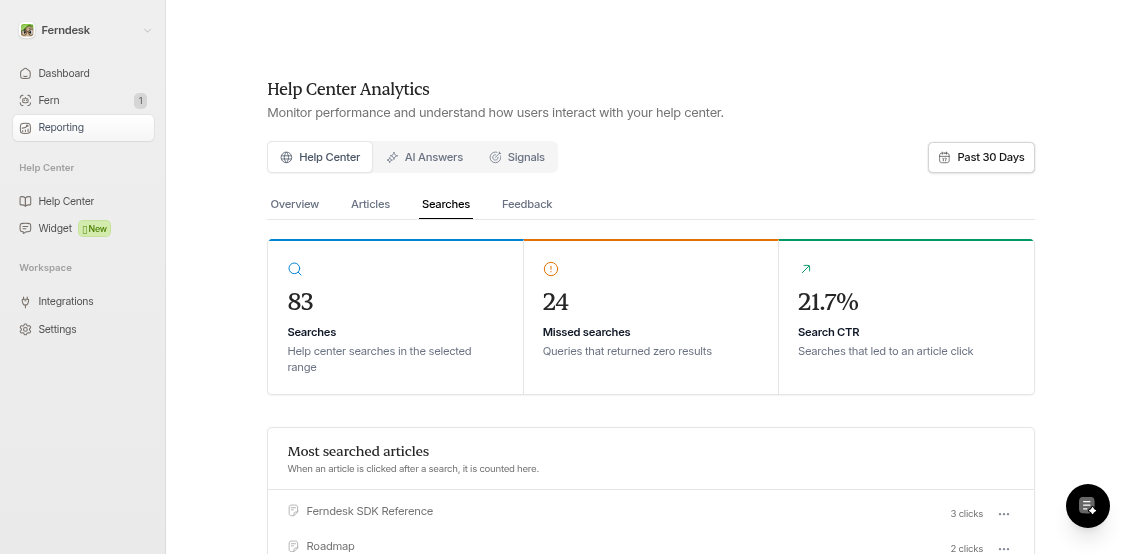
Searches
Monitor what users search for and whether they find results. Filter by Hit (found results) or Miss (no results). Missed searches reveal content gaps—create articles for frequently missed queries.
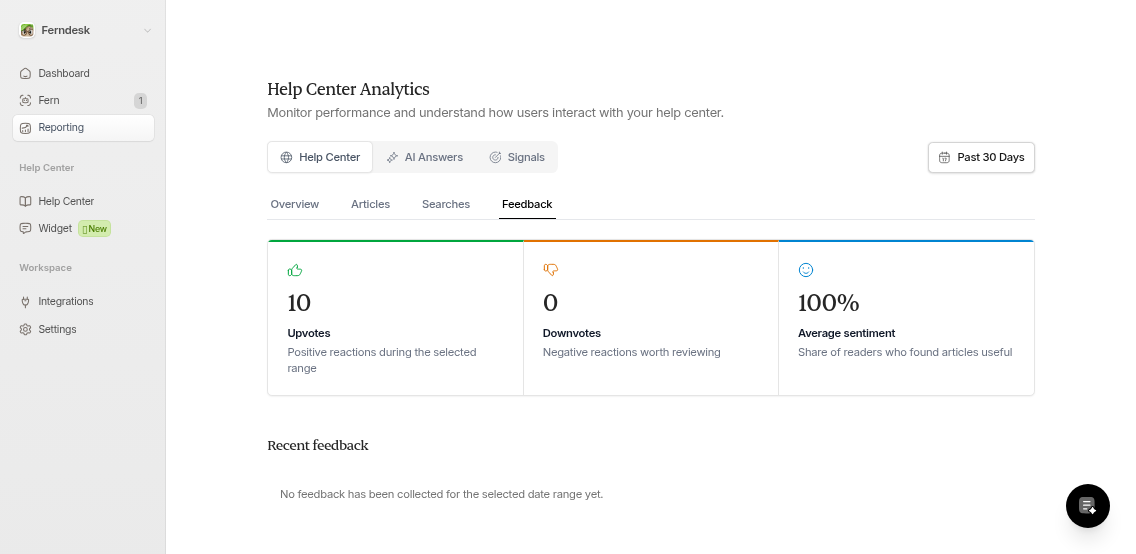
Feedback
View all article upvotes, downvotes, and user comments. High negative feedback signals outdated or confusing content. Click the ellipsis menu on any article to ask Fern to revise based on feedback or edit manually.
AI Answers Analytics
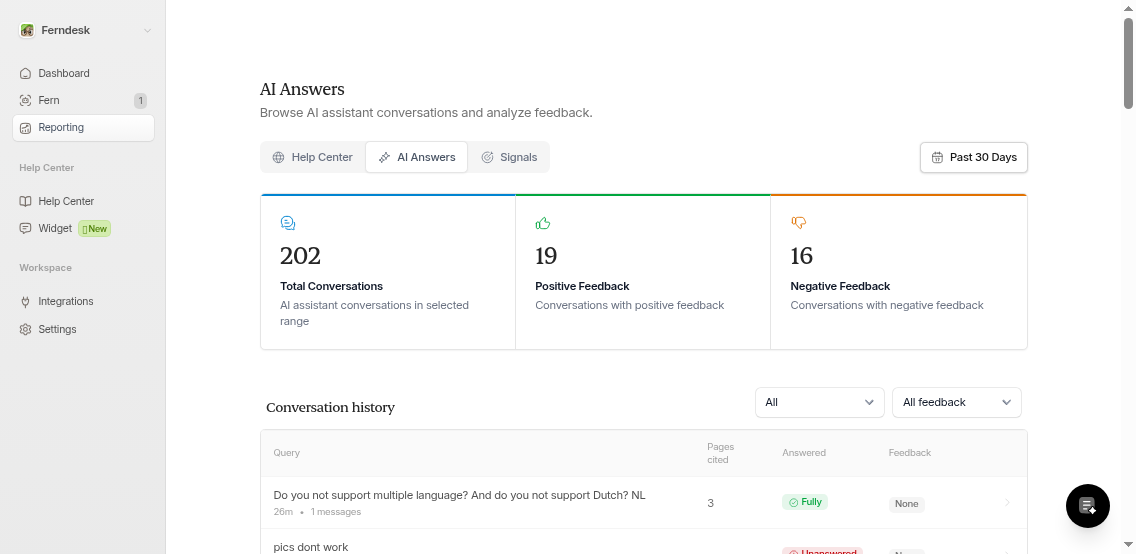
The AI Answers tab shows how Fern responds to user questions in the AI assistant widget:
Total Conversations: How many chats Fern handled
Feedback: Positive vs. negative ratings on AI responses
Coverage: Whether Fern fully answered, partially answered, couldn't answer, or deemed queries irrelevant
The table displays each query, cited articles, answer status, and user feedback. Click any row to view the full conversation. Use "Unanswered" or "Partially" answered queries to identify missing documentation.
Signals
Signals aggregates trends from connected support tools (Intercom, Zendesk, Help Scout, etc.) and product releases. Track support request volume and correlate spikes with recent feature launches.
Using Reporting to Improve Content
Combine insights across tabs for maximum impact:
Find content gaps: Check missed searches and unanswered AI queries. Create articles for repeat topics.
Optimize high-traffic articles: Sort articles by views. If popular articles have negative feedback, revise them immediately.
Deprecate low-value content: Articles with near-zero views over 90 days may be outdated or redundant.
Monitor support trends: Spikes in Signals support requests often indicate missing or unclear docs.
Use the menu in the Articles or Feedback sections to quickly task Fern with rewriting problematic content. Fern auto-loads negative feedback into the task prompt.